---
title: "Dashboard: your site at a glance"
description: "The SiteHive Enviro Dashboard is your daily view of your site with the latest data: every device, whether it is online, its latest readings and captures."
image: https://support.sitehive.com/hs-fs/hubfs/Knowledge%20Base%20Import/homepageimages/enviro-setup.jpg?width=1200&name=enviro-setup.jpg
---
[Skip to content](https://support.sitehive.com/en-au/dashboard-overview#main-content)
[](https://support.sitehive.com/?hsLang=en-au)
Open main navigation
Close main navigation
- [Contact us](https://support.sitehive.com/en-au/contact-us)
[Contact us](https://support.sitehive.com/en-au/contact-us?hsLang=en-au)
How can we help?
- There are no suggestions because the search field is empty.
1. [SiteHive Support](https://support.sitehive.com/en-au?hsLang=en-au)
2. [SiteHive Enviro: dashboard, reports & analysis](https://support.sitehive.com/en-au/sitehive-enviro-dashboard-reports-analysis?hsLang=en-au)
# Dashboard: your site at a glance
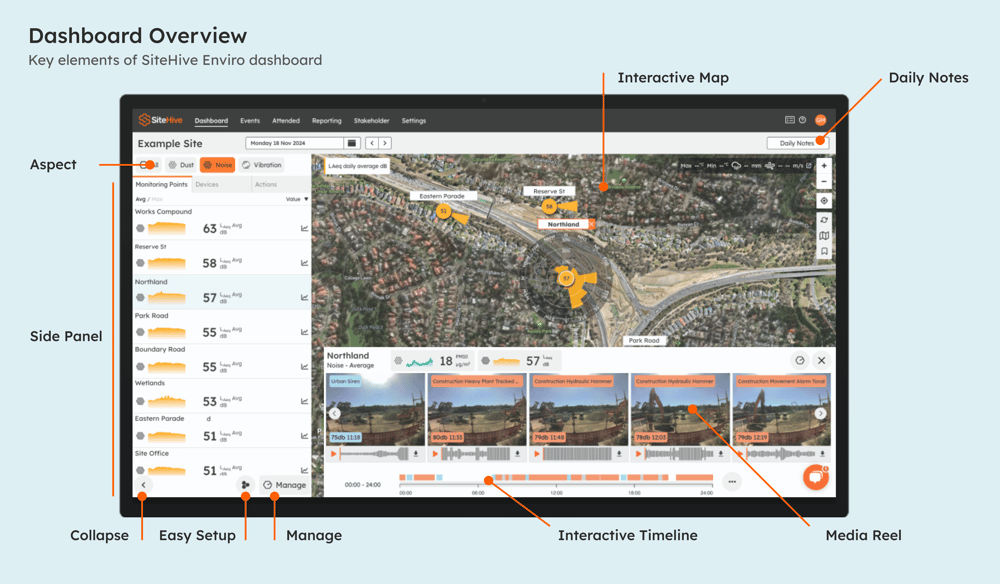
The **Dashboard** is your daily view of your site in SiteHive Enviro, always showing the latest data: where every device is, whether it is online, its most recent readings and what it has captured today. This page gives an overview of its features, and what to explore next.
### The map: status and data at each Monitoring Point
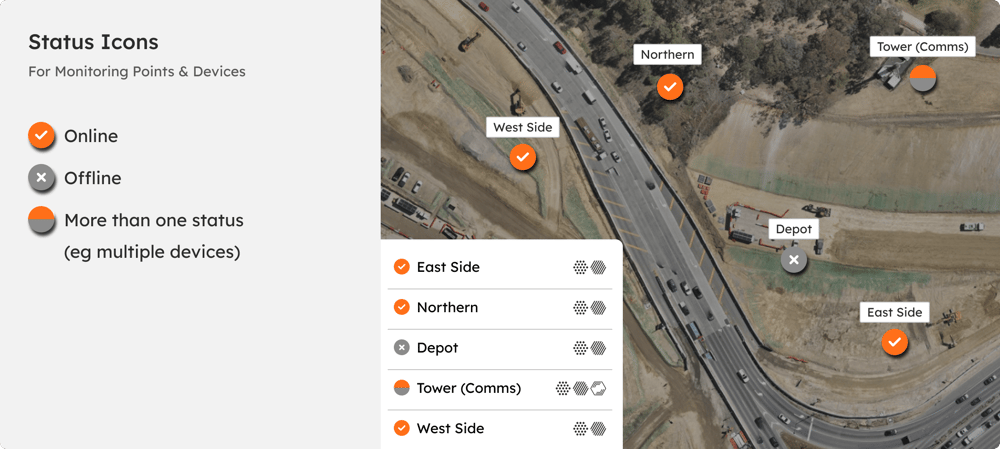
The map follows the aspect you pick in the aspect selector. In the **All** view it shows whether the device at each [Monitoring Point](https://support.sitehive.com/en-au/what-is-a-monitoring-point?hsLang=en-au) is online, so anything not reporting stands out straight away.
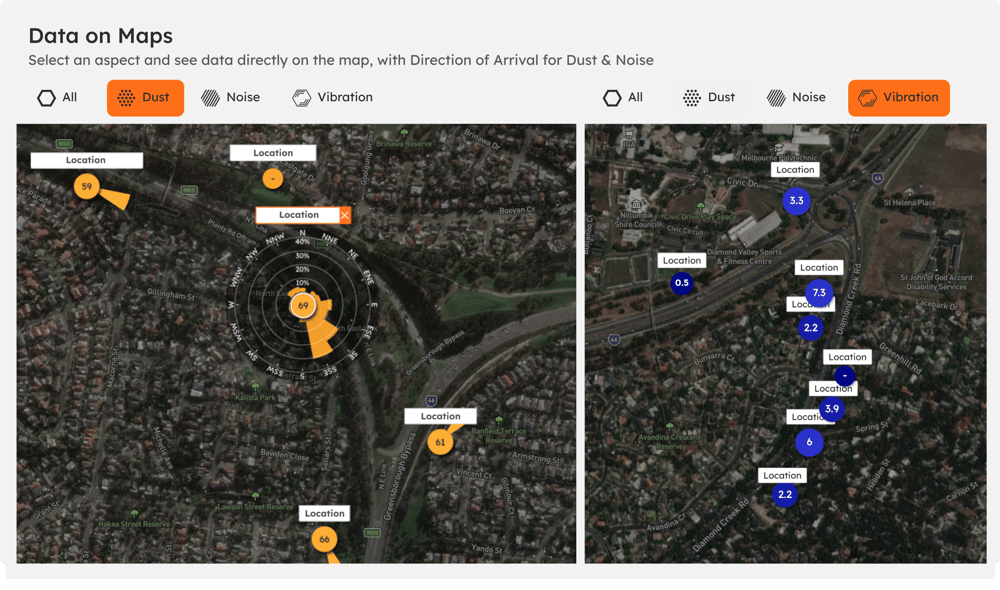
Pick an aspect and the map shows the latest reading at each Monitoring Point instead: for Vibration, the latest vSum. For Noise and Dust it also shows the main direction the noise or dust is coming from, with a percentage breakdown when you select a Monitoring Point.
SiteHive Enviro Pro adds more to the map: [Add survey and aerial maps](https://support.sitehive.com/en-au/add-survey-and-aerial-maps?hsLang=en-au) (a drone survey as the base map), [Add KML map layers](https://support.sitehive.com/en-au/add-kml-map-layers?hsLang=en-au) (your own boundaries and alignments) and [3D building view](https://support.sitehive.com/en-au/3d-building-view?hsLang=en-au) (Monitoring Points by building level).
---
### Side Panel
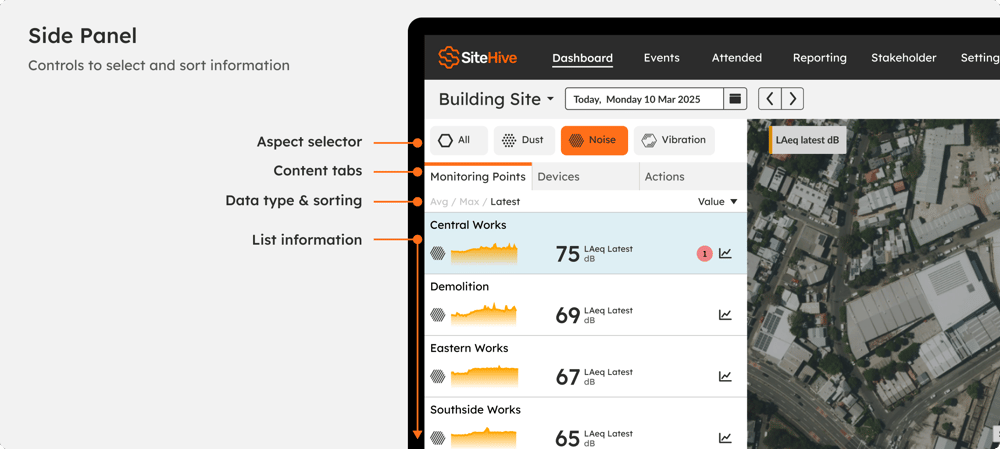
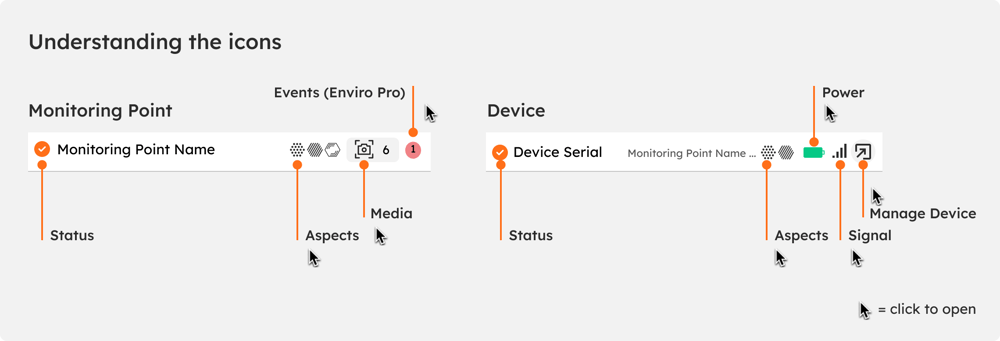
The Side Panel holds the aspect selector, the list of Monitoring Points or devices, and the Actions tab. Each row in the list carries symbols for its status, and several of them can be clicked for more detail.
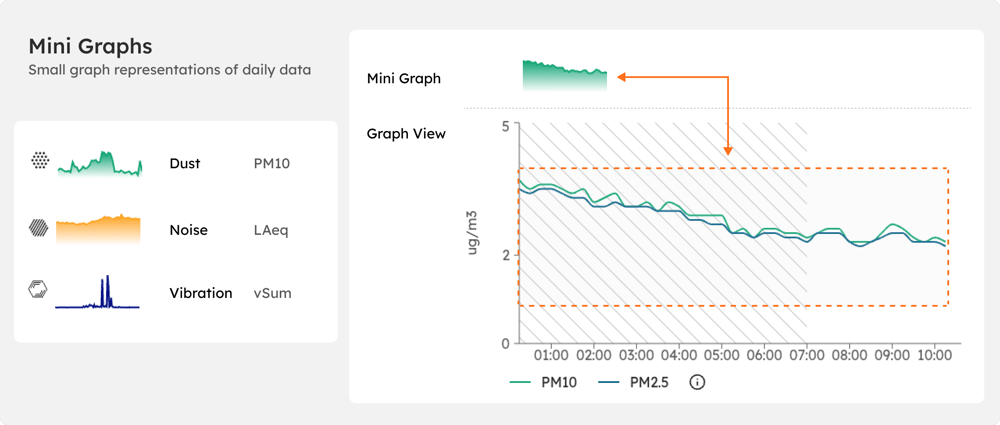
**Mini Graphs** in the bottom tray summarise recent data for the selected Monitoring Point, one per metric. Click one to open the detailed graph.
---
### Graph zoom
In a detailed graph, drag across the time window you want a closer look at, then click the zoom icon.
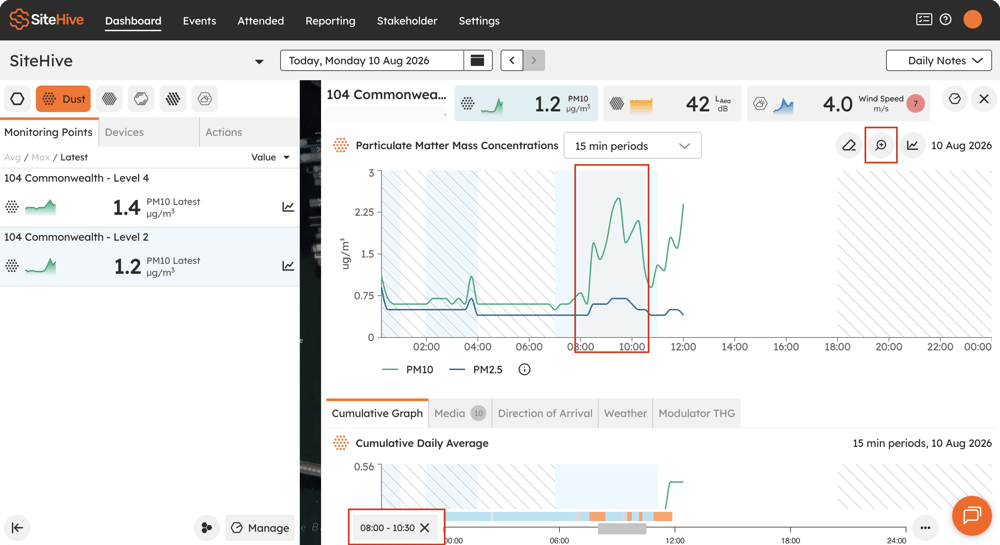
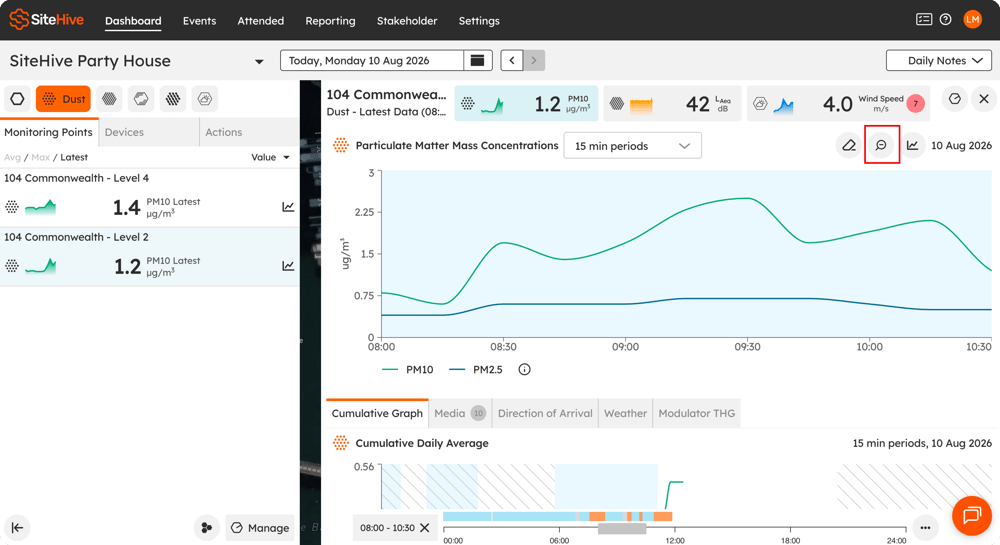
While you are zoomed in, drag or resize the timeline below to pan, and the graph follows. Click the zoom icon again to return to the full view. It is the quickest way to chase down a spike.
---
### Actions tab
The Actions tab in the Side Panel is the shortcut to the jobs you do most often:
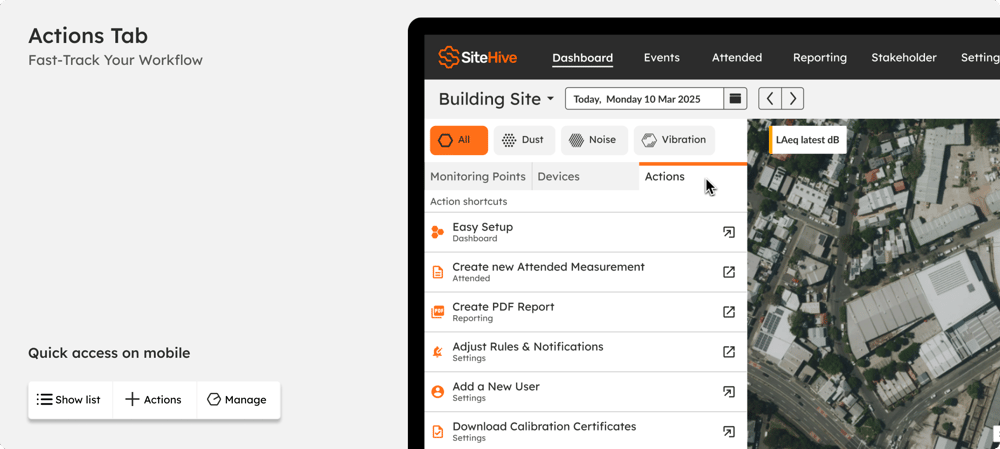
- [**Easy Setup**](https://support.sitehive.com/en-au/add-a-device-with-easy-setup?hsLang=en-au): add a device and its Monitoring Point, rules and notifications in a few clicks.
- [**Attended measurement**](https://support.sitehive.com/en-au/attended-measurements?hsLang=en-au): record a field measurement (SiteHive Enviro Pro).
- [**PDF report**](https://support.sitehive.com/en-au/create-a-pdf-report?hsLang=en-au): create a report for any period.
- **Rules and notifications**: set the levels that alert your team.
- **Users**: invite your team, consultants and client.
- [**Calibration certificates**](https://support.sitehive.com/en-au/calibration-and-certificates?hsLang=en-au): download the certificates for every device in one go.
On a phone, the same actions are under the **Actions** button in the bottom bar, or in **Show list** on the **Actions** tab.
---
### Manage Monitoring Points and devices
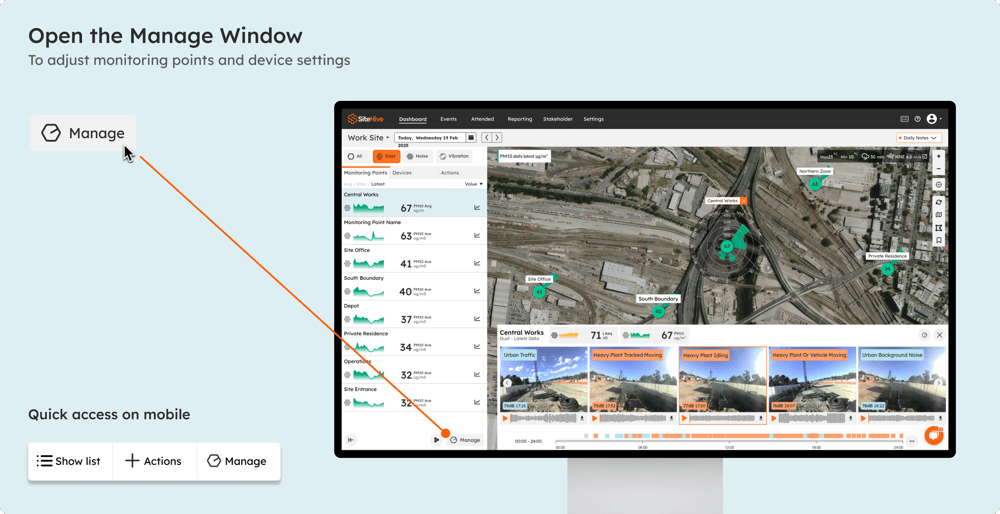
Select a Monitoring Point or a device and click **Manage**. One window opens with a Monitoring Point view and a Device view: settings, rules, media triggers, power, signal and calibration in one place. See [Click Manage to adjust settings and devices](https://support.sitehive.com/en-au/click-manage-to-adjust-settings-and-devices?hsLang=en-au).
---
### Media Timeline
The Media Timeline along the bottom of the Dashboard holds the photos and audio your devices capture at the peak moment of each capture window, so you can see and hear what was behind a reading.
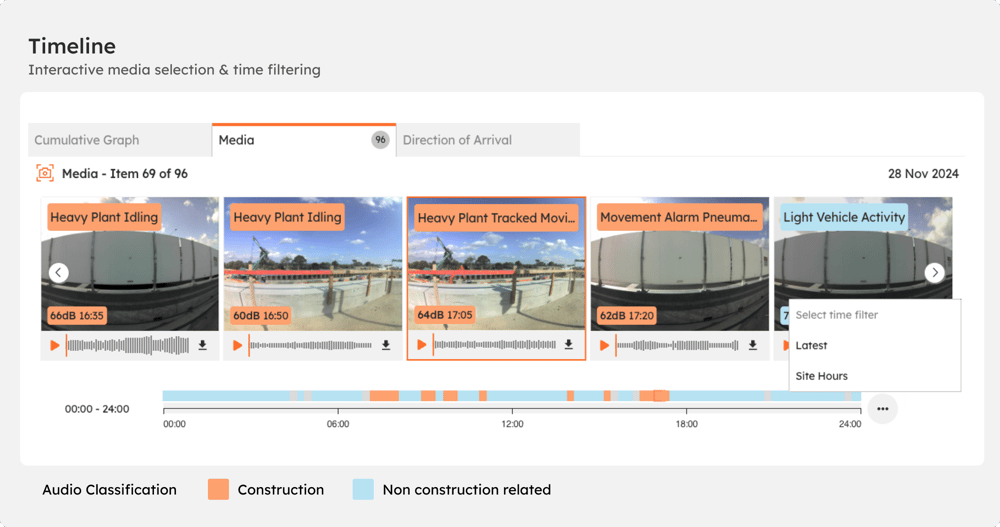
- [**Audio Classifier**](https://support.sitehive.com/en-au/audio-classifier-what-made-the-noise?hsLang=en-au) (SiteHive Enviro Pro): labels each noise clip automatically. Orange (🟠) is site-related noise (reportable), blue (🔵) is external noise (not reportable).
- **Time brushing:** narrow the timeline to a window to look at it in detail.
- **Filter by site hours:** show only captures from your working hours.
To change the level a device must reach before it captures, see [Set up media triggers](https://support.sitehive.com/en-au/set-up-media-triggers?hsLang=en-au).
---
### Daily Notes
Record what happened on site, attach photos and files, and tag Monitoring Points with **Daily Notes** (top right of the Dashboard). Notes can be included in your PDF reports.
---
### Explore from here
Once you know your way around the Dashboard, these are the next things most people learn, roughly in this order.
- **Look closer at your data.** [Graph your data](https://support.sitehive.com/en-au/graph-your-data?hsLang=en-au) (longer date ranges, Monitoring Points side by side, weather alongside), then [Stats and analysis](https://support.sitehive.com/en-au/stats-and-analysis?hsLang=en-au)
- **See and hear what happened.** [Media timeline: the photos and audio your devices capture](https://support.sitehive.com/en-au/media-timeline-the-photos-and-audio-your-devices-capture?hsLang=en-au)
- **Find where it came from.** [Direction of arrival](https://support.sitehive.com/en-au/direction-of-arrival?hsLang=en-au) (which way noise and dust are coming from)
- **Get told when a limit is reached.** [Set up rules and notifications](https://support.sitehive.com/en-au/set-up-rules-and-notifications?hsLang=en-au)
- **Keep the story with the data.** [Daily notes](https://support.sitehive.com/en-au/daily-notes?hsLang=en-au) (what happened on site, in your reports)
- **Report on it.** [Reporting overview](https://support.sitehive.com/en-au/reporting-overview?hsLang=en-au) (graphs, stats, PDF reports and CSV exports, and which to use when)
- **Bring your team in.** [Add and manage users](https://support.sitehive.com/en-au/add-and-manage-users?hsLang=en-au)
- **Looking after more than one site?** [The Portfolio page: every site at a glance](https://support.sitehive.com/en-au/the-portfolio-page-every-site-at-a-glance?hsLang=en-au)
Ready for more? [What is included in SiteHive Enviro Pro](https://support.sitehive.com/en-au/what-is-included-in-sitehive-enviro-pro?hsLang=en-au) covers events, AI classifiers, advanced reporting and more.
[](https://sitehive.com/)
[www.sitehive.com](https://www.sitehive.com)
[mailto:support@sitehive.co](mailto:support@sitehive.co)
Copyright © 2026, SiteHive