---
title: See your first data
description: Every device on site showing a green light? Open SiteHive Enviro, connect each one to its Monitoring Point and bring your team in.
image: https://support.sitehive.com/hs-fs/hubfs/Knowledge%20Base%20Import/homepageimages/enviro-setup.jpg?width=1200&name=enviro-setup.jpg
---
[Skip to content](https://support.sitehive.com/en-au/see-your-first-data#main-content)
[](https://support.sitehive.com/?hsLang=en-au)
Open main navigation
Close main navigation
- [Contact us](https://support.sitehive.com/en-au/contact-us)
[Contact us](https://support.sitehive.com/en-au/contact-us?hsLang=en-au)
How can we help?
- There are no suggestions because the search field is empty.
1. [SiteHive Support](https://support.sitehive.com/en-au?hsLang=en-au)
2. [Getting started: first day on site](https://support.sitehive.com/en-au/getting-started-first-day-on-site?hsLang=en-au)
# See your first data
Every device on site showing a green light? Open **SiteHive Enviro**, connect each one to its Monitoring Point and bring your team in. A few minutes on your phone, and you leave site with data landing and everyone able to see it.
### Log in
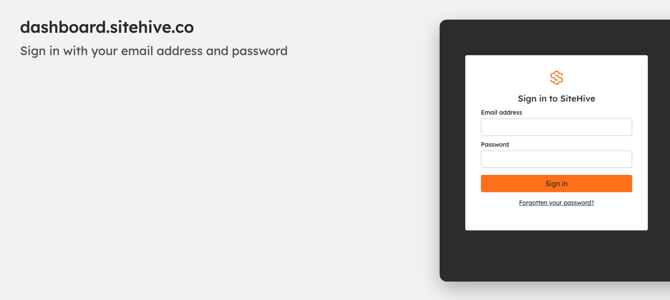
Go to [sitehive.com](https://sitehive.com) and tap **Login,** or enter **dashboard.sitehive.co**, or open the web app if it is already on your home screen ([install it in a minute](https://support.sitehive.com/en-au/install-the-web-app-on-your-phone?hsLang=en-au)). No login yet? Ask whoever administers your project, or contact your Regional Success Manager or [support@sitehive.com](mailto:support@sitehive.com).
### Connect each device with Easy Setup
On the Dashboard, open the side panel, choose the **Actions** tab and start [Easy Setup](https://support.sitehive.com/en-au/add-a-device-with-easy-setup?hsLang=en-au). For each device you installed:
1. **Pick the device.** The one you just bolted down.
2. **Choose or create its Monitoring Point.** This is the named location your data attaches to, so use the names you decided before you came: [What is a Monitoring Point?](https://support.sitehive.com/en-au/what-is-a-monitoring-point?hsLang=en-au)
3. **Set the dates** it is deployed there.
4. **Confirm its orientation.** Drag the dial so the arrow points the way the logo faces, or enter the bearing you took with your compass.
Repeat until every device on your list is assigned. Orientation matters on noise devices because it drives Direction of Arrival; if you were unsure on site, you can [work it out from the camera images](https://support.sitehive.com/en-au/check-and-adjust-your-devices-orientation?hsLang=en-au) later.
> 💡 Drop a context photo of each deployment into a [Daily note](https://support.sitehive.com/en-au/daily-notes?hsLang=en-au) tagged to its Monitoring Point. The record of how it was installed then lives with the data it produces.
### Bring your team in
Go to **Settings \> Users** and invite the people who need to see the site: the site manager, the environmental advisor, whoever fields the call when a neighbour complains. Each one gets an email, sets their own password, and sees the same dashboard you do. [Add and manage users](https://support.sitehive.com/en-au/add-and-manage-users?hsLang=en-au)
### You now have data on your site
Within 15 minutes of the last install, this is what you should see on the Dashboard:
- **Every Monitoring Point on the map**, in the place you put it.
- **All Aspects view:** the status of every Monitoring Point, showing that the devices are online as expected.
- **Pick an aspect** (noise, dust, vibration or weather) and the map shows the latest values at each Monitoring Point.
- **Mini graphs** in the side panel, filling out as the day goes on.
- **Photos and audio** arriving in the Media Timeline once a media trigger fires.
That is the site set up and reporting. If a Monitoring Point shows nothing after 15 minutes, check the device light before anything else: blue means it is recording but not connecting yet, and the data backfills once the signal improves. [LED device lights: what each colour means](https://support.sitehive.com/en-au/led-device-lights-what-each-colour-means?hsLang=en-au)
From here the software is yours to set up properly: [rules and notifications](https://support.sitehive.com/en-au/set-up-rules-and-notifications?hsLang=en-au), reports, and the Manage window are all in [SiteHive Enviro: set up your site](https://support.sitehive.com/en-au/sitehive-enviro-set-up-your-site?hsLang=en-au).
---
### What's next
[Your first login to SiteHive Enviro](https://support.sitehive.com/en-au/your-first-login-to-sitehive-enviro?hsLang=en-au) (the tour: Dashboard, Reporting and Settings)
[](https://sitehive.com/)
[www.sitehive.com](https://www.sitehive.com)
[mailto:support@sitehive.co](mailto:support@sitehive.co)
Copyright © 2026, SiteHive