---
title: "Vibration classifier: what caused the vibration"
description: The SiteHive Vibration Waveform Classifier uses AI to identify the source of every vibration exceedance automatically.
---
[Skip to content](https://support.sitehive.com/en-au/vibration-classifier-what-caused-the-vibration#main-content)
[](https://support.sitehive.com/?hsLang=en-au)
Open main navigation
Close main navigation
- [Contact us](mailto:support@sitehive.co)
[Contact us](mailto:support@sitehive.co)
How can we help?
- There are no suggestions because the search field is empty.
1. [SiteHive Support](https://support.sitehive.com/en-au?hsLang=en-au)
2. [SiteHive Enviro Pro: advanced features](https://support.sitehive.com/en-au/sitehive-enviro-pro-advanced-features?hsLang=en-au)
# Vibration classifier: what caused the vibration
The **SiteHive Vibration Waveform Classifier** uses AI to identify the source of every vibration exceedance automatically.
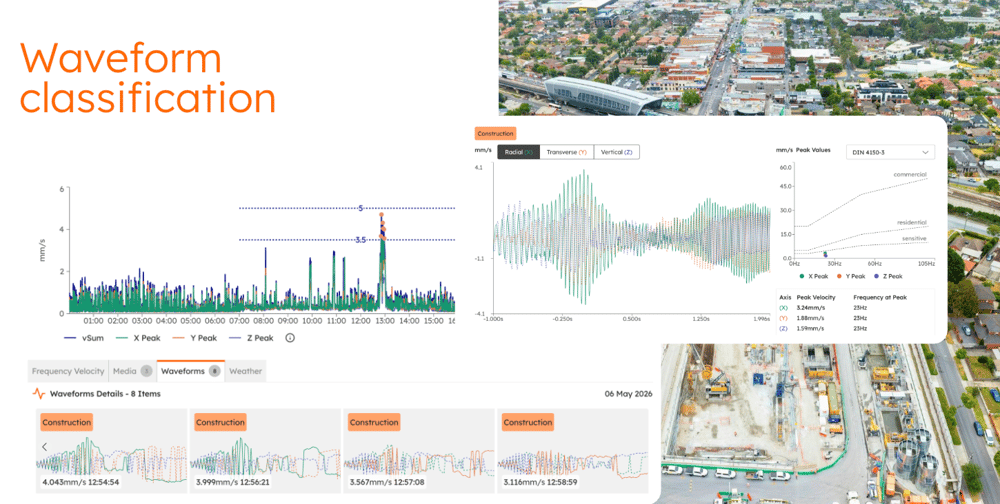
Interpreting vibration exceedances has always been manual work: an exceedance might be real construction activity, an external source, or someone knocking the device.
The vibration waveform classifier takes the guess work out of this process so you can identify sources more quickly and confidently with [SiteHive Enviro Pro](https://support.sitehive.com/en-au/what-is-included-in-sitehive-enviro-pro?hsLang=en-au).
---
#### What is the SiteHive Waveform Classifier?
When a **SiteHive Hexanode Vibration** device records a **PPV exceedance**, it captures the vibration waveform. The SiteHive Waveform Classifier analyses that waveform with AI and labels it **construction** or **non-construction** the moment it is captured.
It is built on the same technology as the [SiteHive Audio Classifier](https://support.sitehive.com/en-au/audio-classifier-what-made-the-noise?hsLang=en-au). Classification runs in real time in the cloud, and every classification is stored against its event, giving you a defensible record for compliance reporting, investigations and audit.
---
#### Understanding waveforms
Vibration sources have surprisingly distinct signatures, which is what makes them so well suited to AI classification.
A waveform shows **velocity over time** for each axis (X, Y and Z). Reading them side by side tells a story, for example:
- **Driven piling** produces a clean, repeating low-frequency pattern, with strikes evenly spaced.
- **A knock on the device** is a single sharp spike with almost no lead-in or decay.
---
#### What the labels mean
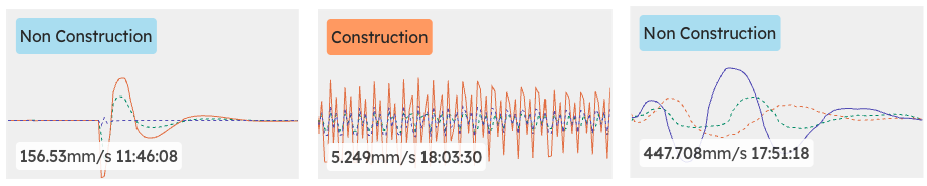
If you already use the Audio Classifier for noise, you know how to read it. Each waveform carries one of two labels:
- **Construction** (shown orange): vibration generated by site activity.
- **Non-construction** (shown blue): external sources or human-induced events, such as a knock on the device.
---
#### How to view vibration waveform classifications
On your SiteHive Enviro Pro Dashboard:
- Select the **Vibration** aspect and your **Monitoring Point**.
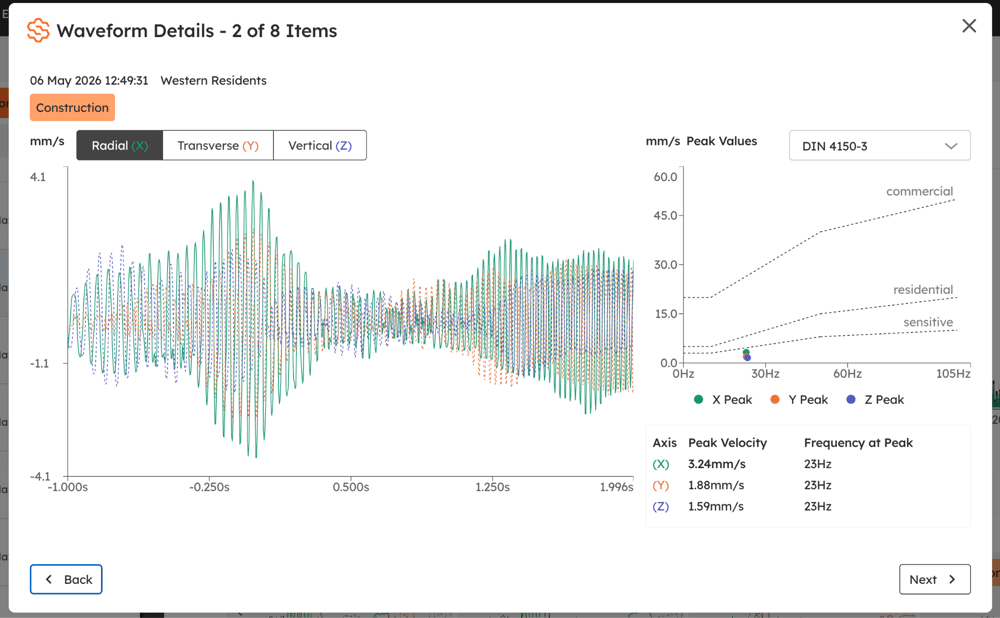
- When a PPV exceedance has been recorded, the captured waveform appears with its classification label.
- Click any waveform to open the detail view, where you can see the **X, Y and Z axis traces** and what drove the exceedance.
To triage exceedances in bulk, go to the [Events](https://support.sitehive.com/en-au/events-investigate-an-exceedance?hsLang=en-au) page:
- Select the event you want to investigate.
- Click **Investigate & Explain** to see the classification alongside the event details.
- Use the classification to decide straight away whether the event needs action or can be explained as non-construction.
#### What's next
[SiteHive Vibration: what it measures and how](https://support.sitehive.com/en-au/sitehive-vibration-what-it-measures-and-how?hsLang=en-au) (PPV, VDV and the waveforms behind them)
[Events: investigate an exceedance](https://support.sitehive.com/en-au/events-investigate-an-exceedance?hsLang=en-au) (record, investigate and explain exceedances in bulk)
[Audio Classifier: what made the noise](https://support.sitehive.com/en-au/audio-classifier-what-made-the-noise?hsLang=en-au) (the same idea, for noise)
[](https://sitehive.com/)
[www.sitehive.com](https://www.sitehive.com)
[mailto:support@sitehive.co](mailto:support@sitehive.co)
Copyright © 2026, SiteHive