
A Monitoring Point is a location on your site where monitoring is happening. You assign a device to a Monitoring Point for a period of time, with a start date and an end date.
Each Monitoring Point is located on a the map, and its name appears in graphs and reports. It also holds that location's settings, and keeps them even when a device is changes: rules, notifications and media triggers are set for each Monitoring Point, so two locations on the same site can be treated differently.
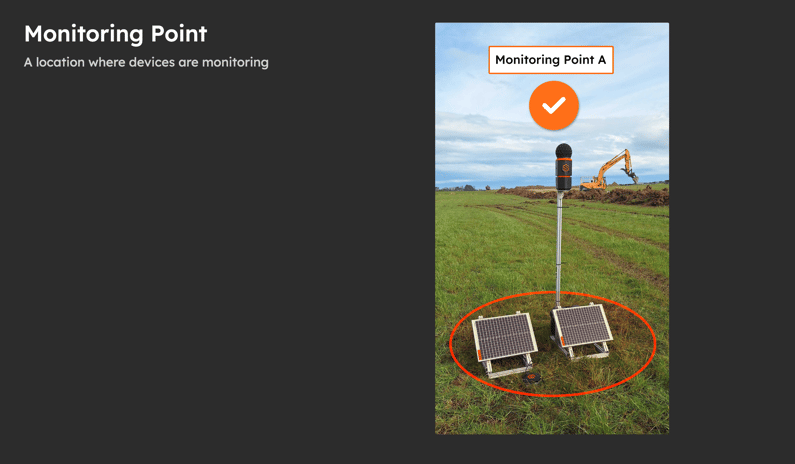
Monitoring Points are created using Easy Setup
Monitoring Points are created using Easy Setup, when you assign a device to a location. Once setup your Monitoring Point is visible on the Dashboard map showing the associated aspect data.
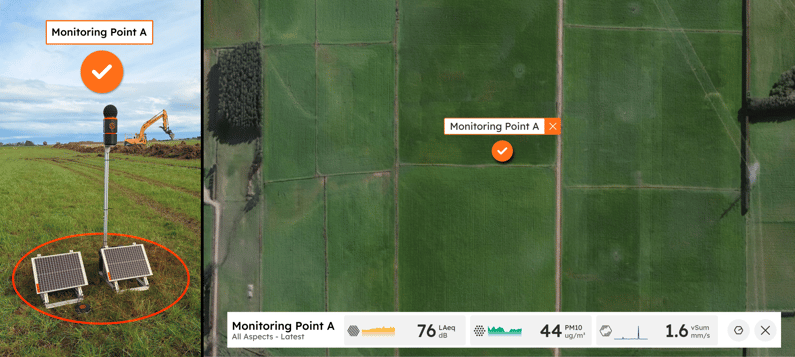
What is shown and set at a Monitoring Point
Data and graphs. The Dashboard map shows the latest values at each Monitoring Point, and Reporting > Graphs lets you graph by Monitoring Point to compare locations.
Rules and notifications. Rules are assigned per Monitoring Point, so the one at your boundary and the one at a receiver can have different limits.
Media triggers. Whether media is enabled to capture.
Daily notes. Tag a note to the Monitoring Point and it is reported against that location.
Reports. PDF and CSV reports are organised by Monitoring Point.
Position and orientation. The Monitoring Point has a position on the map; and Noise device have orientation, which Direction of Arrival depends on.
Naming a Monitoring Point
Use the name people on site already use: North boundary fence, Receiver R3 Smith St, Site office.
Name the place, not the device. Serial numbers change when a device is swapped; the place does not.
Keep it short. Names appear in graph legends, notification emails and report tables.
If the same spot carries two aspects, one Monitoring Point is enough; the aspect is a property of the device, not the Monitoring Point.
Where you see Monitoring Points
The Dashboard side panel lists them, with status symbols, and the map places them.
The Manage window opens on a Monitoring Point view (its devices, rules, media triggers and setup) or a Device view.
Settings > Devices & Monitoring Points lists every Monitoring Point and device on the site.
Reporting > Graphs has a Graph by Monitoring Point option.
What's next
Add a device with Easy Setup (create a Monitoring Point and assign a device to it)
Edit, end or move a device (dates, orientation, moving between Monitoring Points)
Graph your data (compare Monitoring Points over time)