
SiteHive Weather puts an on-site weather station, the SiteHive Hexanode Weather, into SiteHive Enviro. You see the conditions at your site, not at the nearest public station, alongside your noise, dust, vibration and water data, with a forecast for the days ahead.
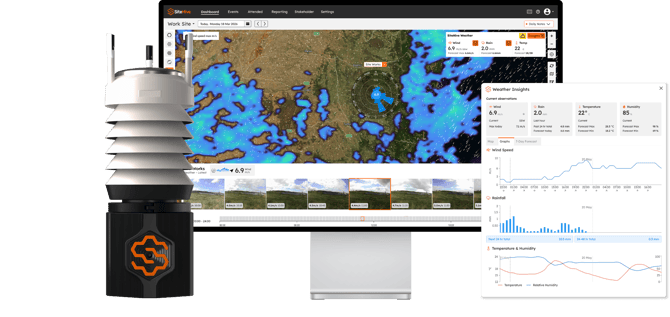
At a glance, SiteHive Weather gives you:
- Live site conditions: wind, rainfall, temperature and humidity.
- A forecast: a daily summary and weekly forecast for your site.
- Alerts: notifications for wind gusts and rainfall.
- Site images: captured every 15 minutes, so you can see the conditions for yourself.
- Context for your other data: weather-affected periods highlighted on your noise and dust graphs.
ℹ️ To add SiteHive Weather to your project, contact your Regional Success Manager or support@sitehive.com.
What it measures
The device samples conditions every minute and sends them to SiteHive Enviro over 4G or Wi-Fi.
- Wind speed and gusts: for crane and lifting operations, and dust management.
- Wind direction: to understand where dust is heading, especially towards sensitive receivers.
- Rainfall: for surface water inspections and erosion and sediment controls. Rainfall is accumulated over each period, so you see meaningful totals.
- Temperature and humidity: for heat stress awareness and daily planning.
The device also captures a site image every 15 minutes. Images appear in the media strip on your Dashboard, so you can scrub through the day and check conditions for yourself.
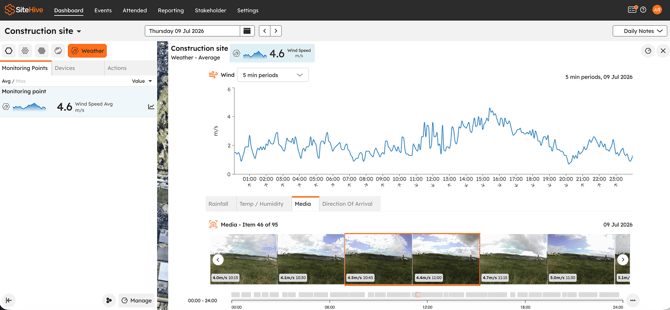
ℹ️ On SiteHive Enviro, weather data is shown in 15-minute periods. On SiteHive Enviro Pro, you can choose 1, 5, 10 or 15 minutes for each Monitoring Point in the Setup tab. See Click Manage to adjust settings and devices.
See it on your Dashboard
The Weather Insights card on your site map shows a daily summary of recorded conditions and the weekly forecast for your site.
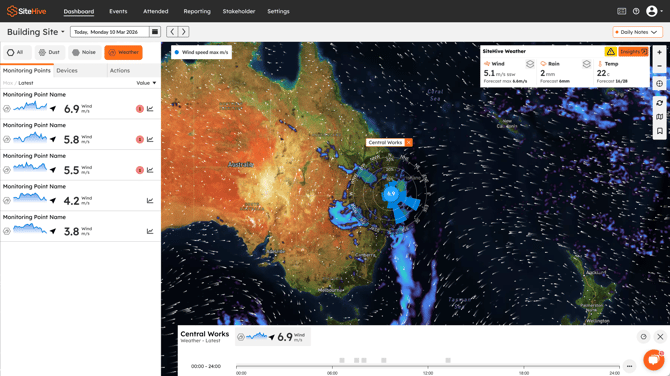
Select the Weather aspect to see graphs for wind, rainfall, temperature and humidity at each Monitoring Point. The forecast continues past the current time as a dashed line.
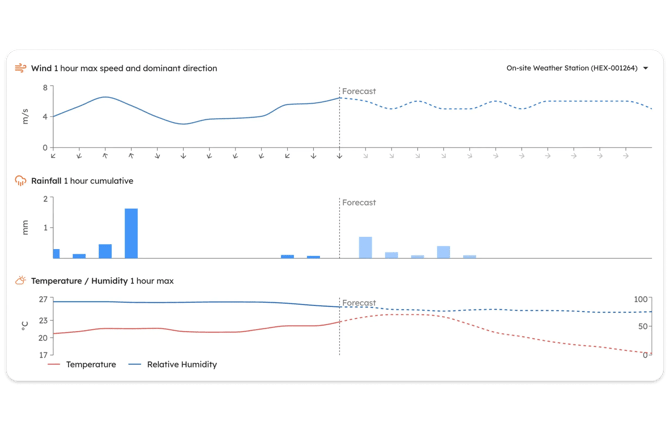
On SiteHive Enviro Pro, you can also add wind, temperature and rain radar layers to your map.
💡 Tip: Make sure your site location is set correctly in Site Details, so the forecast is for your exact site.
Weather alerts
Set rules and notifications for wind speed, rainfall and heat (wet bulb temperature), so your team hears about weather risks while there's still time to act.
You can also turn on a site-wide rainfall notification, which tells your team at 8 am if rainfall in the past 24 hours went over your nominated amount. That's useful for triggering surface water inspections.
💡 Tip: Wet bulb temperature combines heat and humidity, so it reflects heat stress on your team better than air temperature alone.
Weather context for noise and dust
Weather can explain readings that look odd on their own. Wind can carry dust towards a Monitoring Point, and rain or high wind can raise noise levels.
On your noise and dust graphs, weather-affected periods are highlighted automatically, so you can see at a glance when weather may have influenced a reading. You choose what counts as weather-affected in Graph settings, using the button on the Dashboard graph and on your other graphs.
Reporting
- Graphs: in Reporting > Graphs, choose Weather to explore trends over any date range and compare devices.
- Stats and analysis: stats cards show average wind, accumulated rain and average temperature for your selected period, with data tables you can download. See Stats and analysis.
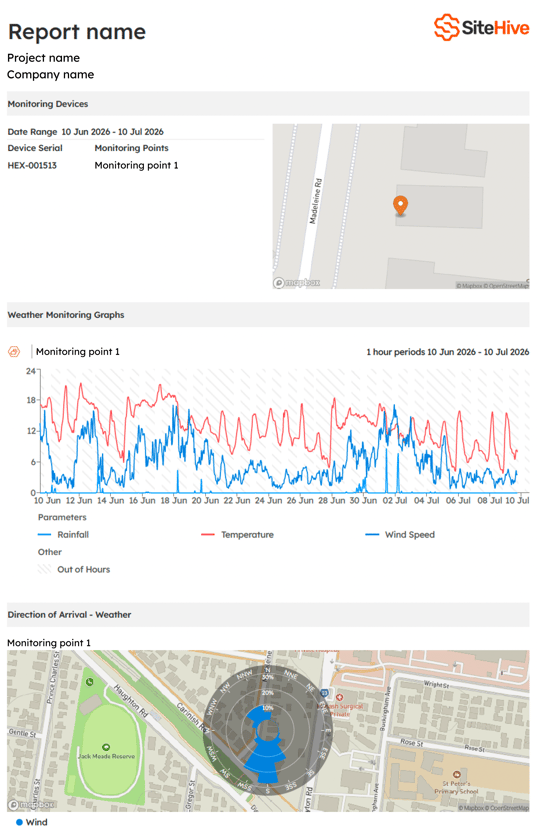
- PDF reports: include graphs of wind speed, wind direction, rainfall, temperature and humidity. See Create a PDF report.
- CSV exports: download the raw data for every parameter, with timestamps in your site's timezone. That's ready to compare with public weather sources, or to support investigations and claims. See Export a CSV report.
What's next
Install your SiteHive Hexanode Weather (the one device where placement decides the data)
Set up rules and notifications (wind, rainfall and heat alerts)
SiteHive Dust: what it measures and how (how wind direction feeds dust Direction of Arrival)